Analysis of Shutterstock Earnings compared to online photo files
A common fear among stock photographers is that it is a “losing” battle – you need to keep uploading images just to keep your earnings where they are. I decided to update an analysis I did a year or so back to see if my uploads to Shutterstock (and to the other sites) were increasing my earnings.
First, the methodology. Each month I make a note of the earnings from each site and for most of them, I also note the number of images online at the end of the month. A simple division gives me the earnings per online file, although this underestimates that number a little as files uploaded in the month have not really been available for sale. Some people believe that you should calculate earnings divided by the total number of files you have attempted to upload as that represents your “work” but I don’t do this because I know that some sites just don’t like certain types of image and it seems wrong to penalize those sites by including images that I know they are going to reject.
For Shutterstock, I also record total downloads, earnings from subscription, on-demand, enhanced license and single downloads so I can track how those have changed. I noted a few months back that enhanced licenses seemed to have dried up for me, and so this analysis tries to identify if they have gone to other categories of download.
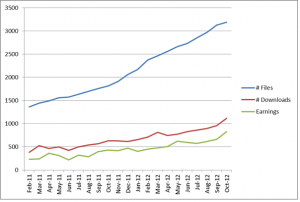
The first exhibit: How have the three categories of online files, downloads and earnings varied over time.
It is hard to see from this graph, but I have doubled my online files, doubled downloads and more than doubled earnings. It looks good, but more detail is needed!
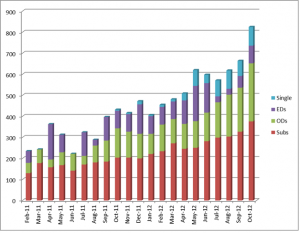
Next up looks at the composition of my earnings each month. Here you can really see the growth in income, and also how the “on demand” category has been growing faster than the subscriptions. EDs grew very nicely until June 2012 and then have dropped away, but the Single downloads have increased significantly since then:
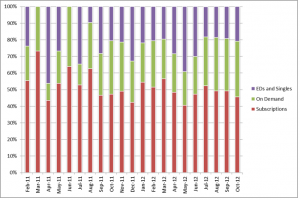
To show the split between categories, I turned this into a percentage graph:
This shows that, over the past 2 years, the percentages of earnings from subscriptions hasn’t changed much – around 50% or so, and the combination of EDs, singles and ODs has filled in the remaining income. At a top level, On demands seem to be around 30% of earnings each month with EDs and Singles the remaining 20%.
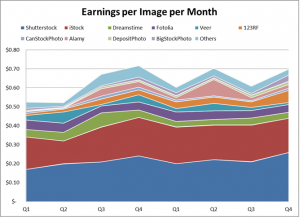
My final chart is a work in progress, as the final quarter of 2012 only includes one month and it was a good one! However, this is the one that shows how much I am earning per online file at the main stock sites. Shutterstock started at $0.17, and ended at $0.26, but probably averages around $0.22 or so. 123RF started at $0.01, but ended at $0.06 after a really good October, but it will be interesting to see if the quarter average maintains that. Even so, 123RF was up around the $0.03 to $0.04 range before this last good month. The overall total has been varying between $0.6 and $0.7 per online image since mid 2011, having grown from $0.52 at the start of that year.
My conclusion – adding new files seems to directly result in increased income in a straight line fashion. As long as the files are OK and are reasonable saleable, then I do appear to get around $0.70 per month per new online file.


