
Earnings per ounce of effort
The discussion about the graph I published yesterday about my return per image is interesting over on the Microstock Group. I thought it might be interesting to explain how I calculated this, what alternatives there are and to show one area of good news!
So what is Return per online image? Simply put, it is the earnings you get from an agency divided by the number of files you have. The interesting question is how do you count those files? There are those that say that your effort goes into the creation of a portfolio of files and not all of those are accepted by all agencies for whatever reason. Some of it might be because they don’t take editorial, they might think there are too many similar images or they might think an image has no commercial value. But you have still created that image and spent time on it. So that calculation should take your total earnings and divide by the total number of files you have in your portfolio.
Option 2 is to take the earnings on each agency in turn and divide by the number of images on that agency. So if they don’t take editorial, then you get a measure of how they are doing with the ones they do take.
Option 3 is to do what I did this time – take the total earnings and divide by an average of files on the three biggest earning agencies. Not just as accurate, but good for a trend. That is the graph I published yesterday and is here for comparison:
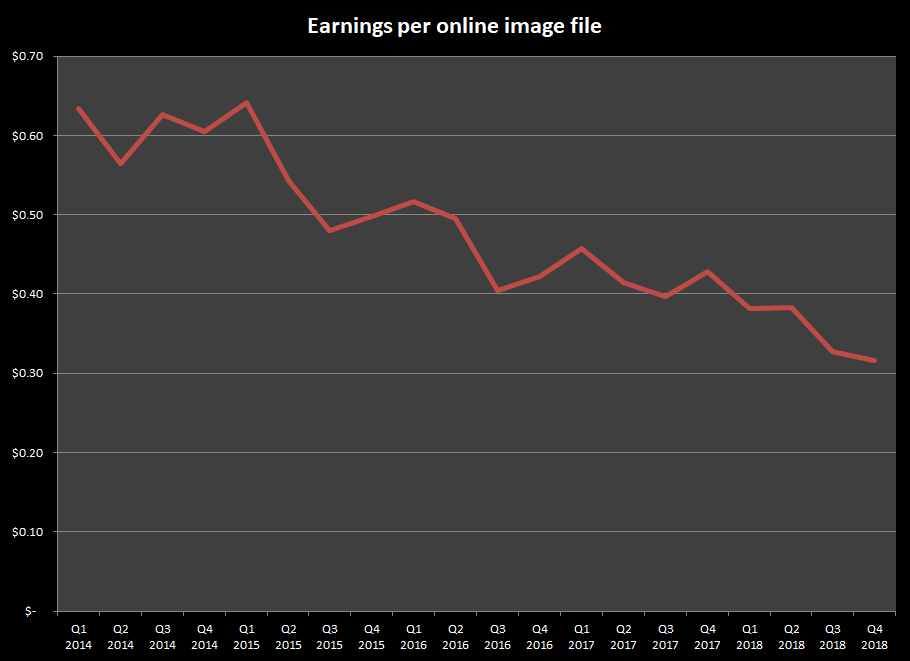
This is also a quarterly calculation so it evens out the variability of the months. The earnings are monthly though. So my average portfolio of 9,000 images in the final quarter of 2018 should earn about 9,000 x $0.32 = $2880. Not every month was that high, but it is close enough.
But where is the good news? Not all agencies are trending in the same way. I don’t really have my quarterly numbers calculated as smoothly for every agency and so I moved to monthly calculations, but Adobe Stock is showing a pretty nice trend:
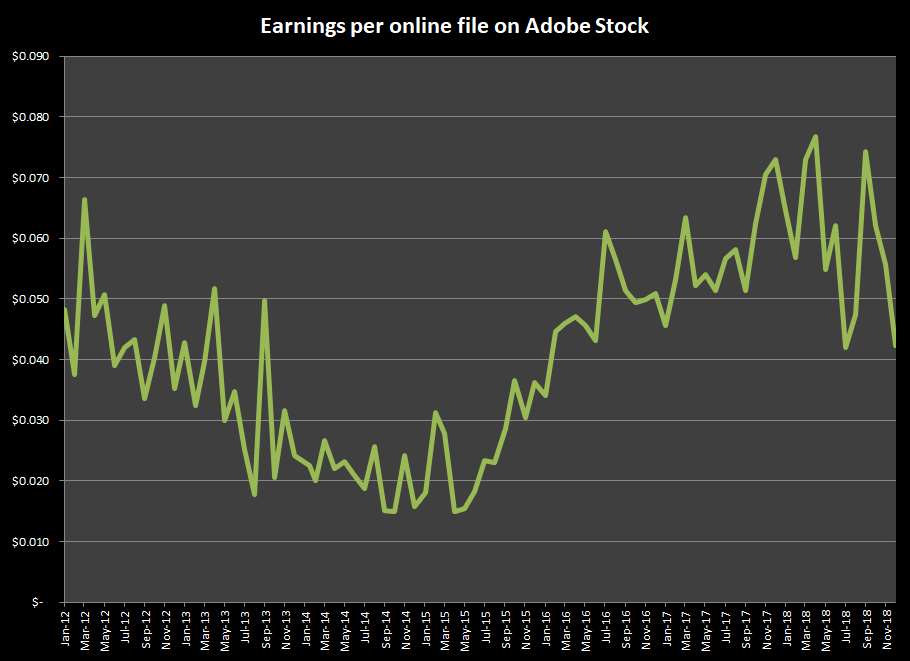
The last three or four months have been more volatile – mainly because I have added a lot of those China shots I think – but the trend since Adobe bought out Fotolia in around 2014 has been pretty positive. Fotolia was going downhill fast (at least for me) but it has really turned round under the new management.
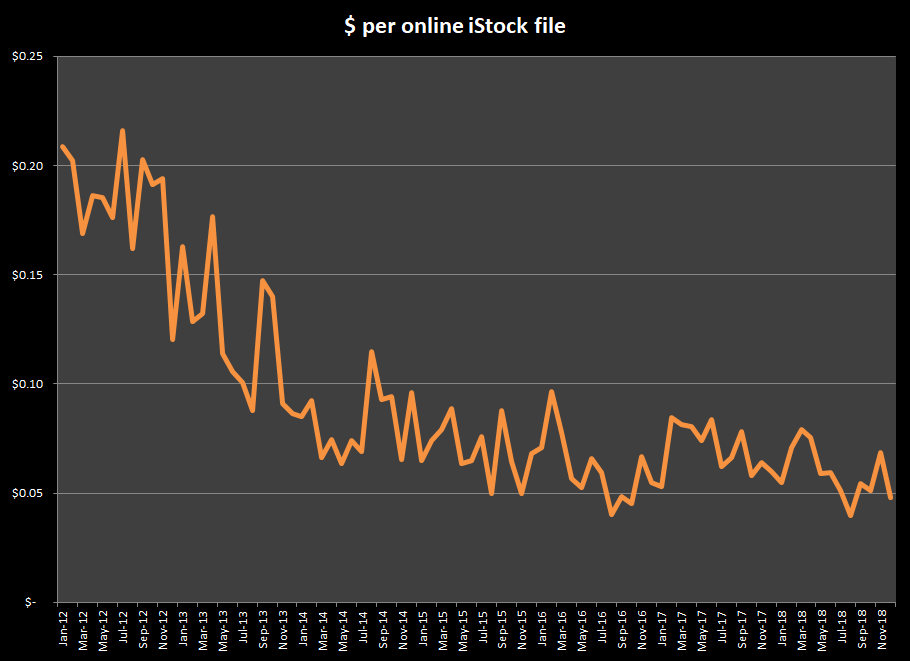
Other sites are doing OK (or fair to middling as we used to say in England). iStock was following the same trend as Fotolia from 2012 until late 2014, but it has leveled out since and is not performing too badly. Again, there are up and down months, but generally it is stable:
So what is bringing down the average to give me the quarterly chart I started with? Well, a company that we will perhaps not name and shame, but it is one of the big players…
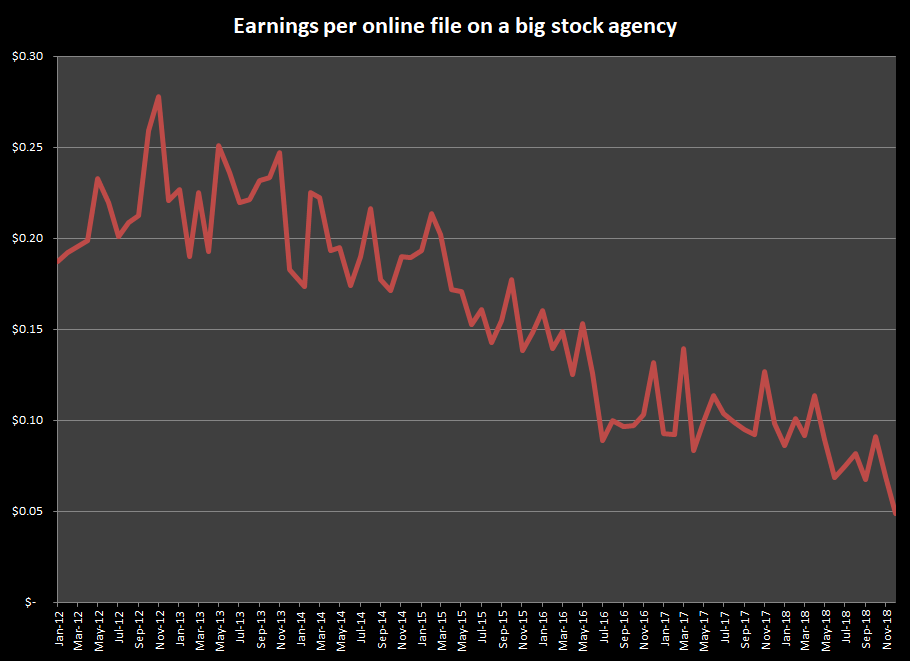
Doing pretty well through 2012 and 2013, but the rot really set in when they started accepting pretty much anyone and any image into their ever growing library.
I’m not sure that the overall message is any better than it was, but there are brighter areas. Someone on the forum said I should be looking at more exclusive, higher value sites. I’ve asked for more details and examples and will, of course, let you know if I find anything of interest.