
Microstock Analytics – Deep Dive into your sales
In previous posts I have reviewed the use of Microstockr Pro for monitoring your sales and how I used it to find images that were selling well but missing from one of the main agencies. There is an alternative application on the market that promises far more detail about your portfolio and so I decided to investigate Microstock Analytics in more detail. This is a far more complex system aimed at really understanding which shots are selling and why, whereas Microstockr Pro is more like a fun system to see the sales coming in. Microstock Analytics is available for Windows and is priced based on the number of images on any number of sites. At present, if you have no more than 500 images on your various sites, it is free. The next band to 1000 images is $29.99 a year, 2000 images is $59.99 a year, and then unlimited images are $119.99 a year or $299.99 as a one-time payment. The system currently covers seven agencies, Shutterstock, iStock, Dreamstime, Adobe Stock, 123RF, BigStock and DepositPhotos.
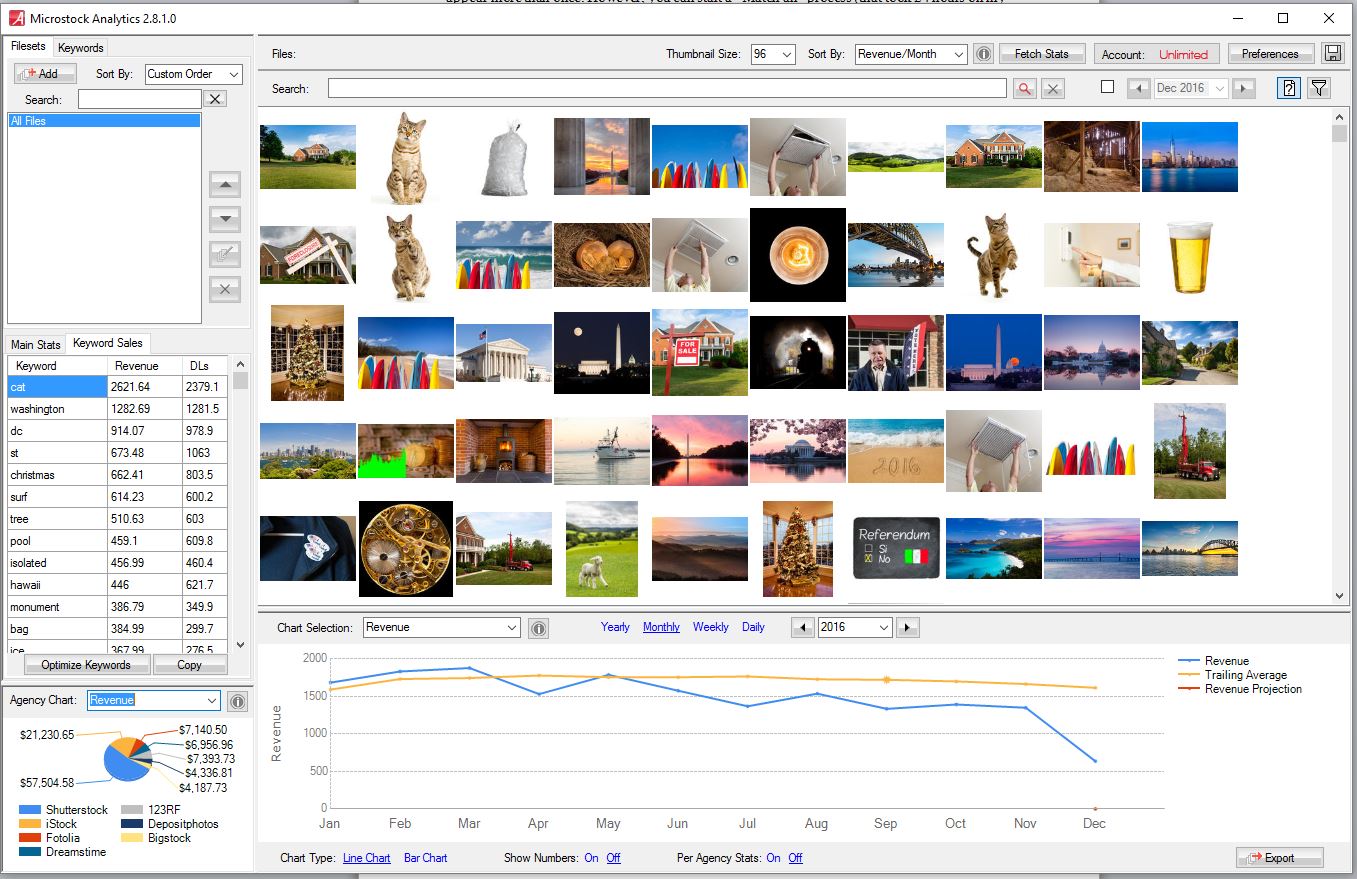
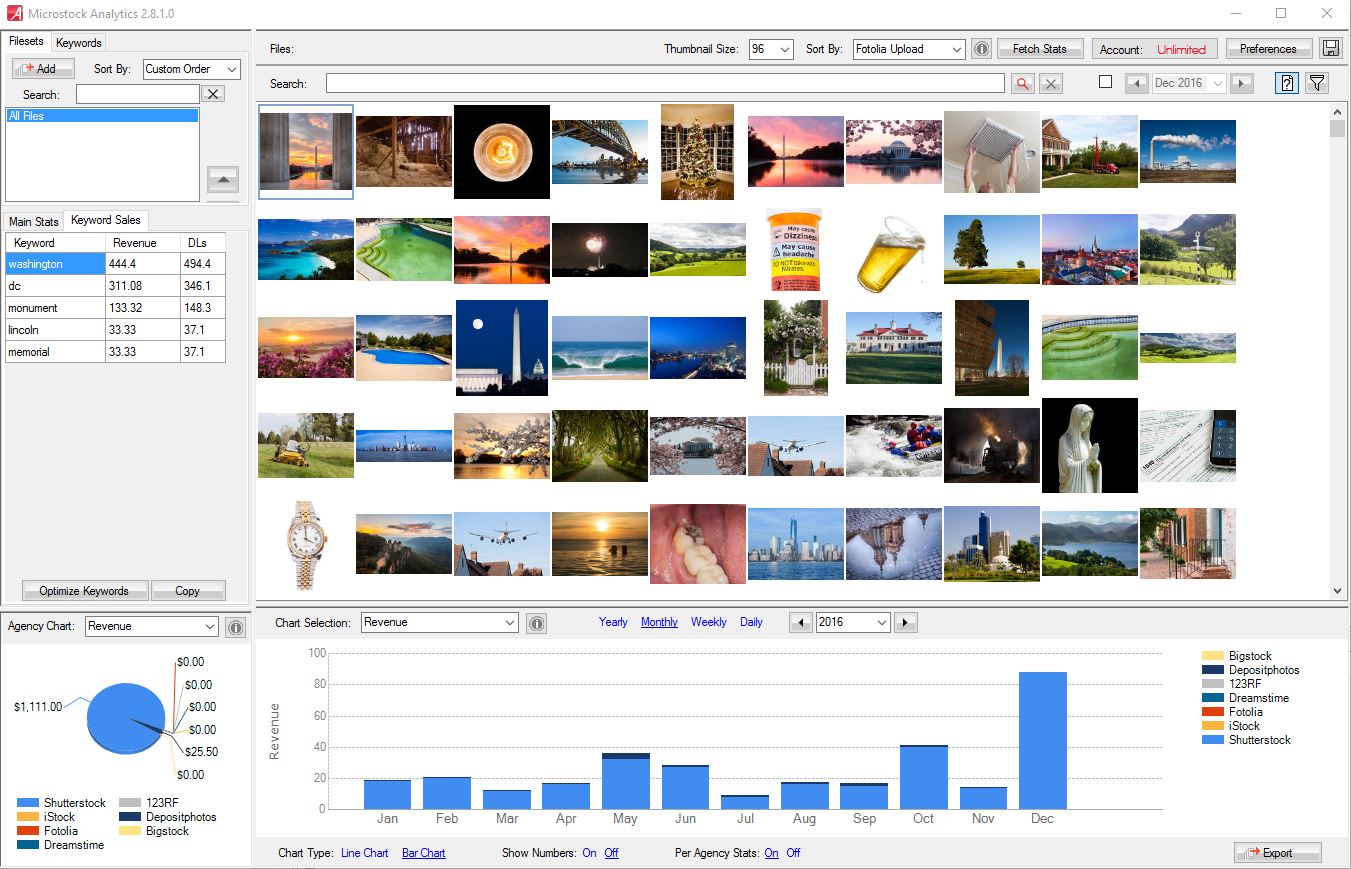
The main screen gives you the overview of your earnings performance, with many different choices for each window. This view is showing the images with the highest revenue per month, which is a nice way of looking at the actual success rate of images. Of course, an image uploaded in 2008 will likely have a higher total revenue than one uploaded in 2015, but revenue per month gives you a better idea of what is performing well on a month to month basis. As you can see, the image of my house and the one of the cat continue to perform well on a month to month basis as well as in total earnings.
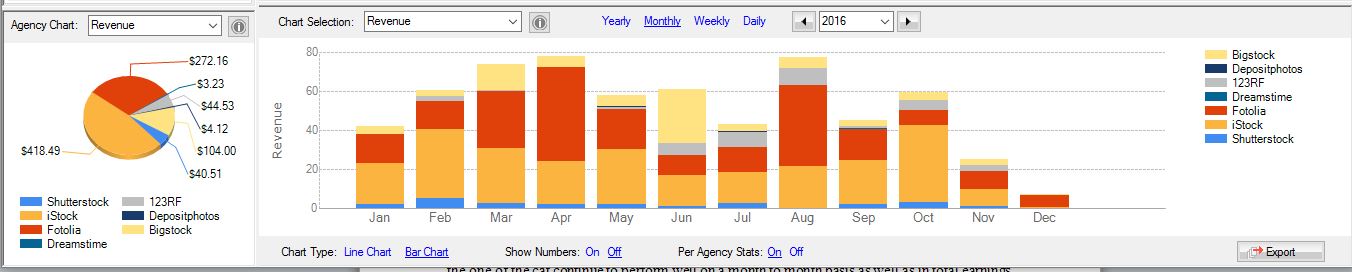
Selecting one of the images (the picture of the house) allows you to see how that performs month by month across different agencies:
You can also see which keywords a buyer used to search for that specific image which will help optimize your keyword order:
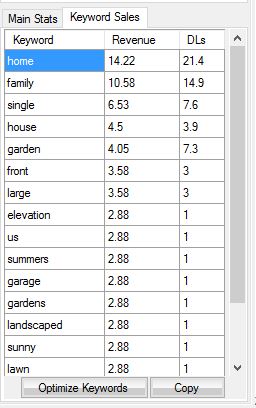
This comes from information that Shutterstock and Dreamstime provides to contributors – what the buyer used in the search field that caused them to see your image. This isn’t available on all sales as they may just have seen your image in a “similar” page perhaps, but shows in this case that Single Family Home are the key keywords that people used for this particular image. While I did include those as my important keywords, I’m not sure I would have thought of “front”. I did a similar search for one of my surfboard images:
![]()
The keywords for this were:
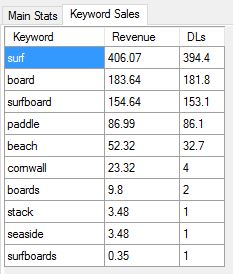
What I found interesting in this one was the high ranking of “board” with 181 sales and then paddle with 86. I could have guessed that people would search for “surf board” as two separate words, but “paddle”? That wasn’t in my list of key words. As many readers know, I didn’t pay much attention to the keyword order on Fotolia in the past which I am sure has hit my sales at that site. As a result, I am going through each image in turn (which is a big task) altering the keyword order. This bit of insight from Microstock Analytics has given me the perfect priority list for my new keyword order and I’m making sure that when I keyword popular images that I do a quick check to see what the important keywords have been in prior sales.
What about finding images that are selling well on some sites, but not on others. There are a series of choices for “sort order”, one of which is a sort of Fotolia uploads but in reverse order – ie big sellers in general but no sales on Fotolia:
This immediately shows me the image that are selling well, on which sites they are selling, and it tells me which images are worth uploading to Fotolia. There is always a chance that the program is not matching the files across all sites perfectly and so I do a quick search on the Adobe Stock site for my keywords before uploading, but it is a neat way of finding worthwhile images to upload.
You can also sort by Return on Investment (RoI) which shows you your actual profit if you group images together into a set and assign some costs to them. I hadn’t mentioned sets, but you can create groupings of similar images and track the various revenue and sales numbers of those.
You want more? You can select a number of images of the same theme and the program will optimize the keywords by revenue so if you upload to Alamy, which requires a set of important keywords, you can use this analysis, and the program will identify the required number of keywords that have the most sales associated with them. I fell like I am only scratching the surface of the program here, but you can see that the amount of information that is available to you is immense, especially once you have some history of sales.
If you can think of something else you would like to know, you can also download all the sales information into a spreadsheet to do your own analysis if there is not enough detail here already! This isn’t a “fun” real time sales tracker though – the stats are updated only when you ask for them and they can take some time on a large portfolio to completely update. But for research purposes rather than just making you feel good, it is perfect.


Wow, that does take a deep dive into your statistics! I can see how that would be very useful to help you optimize your stock catalogue.