Stock Photo Earnings Trends through 2023
In my normal monthly report, I commented on the disappointment I had felt throughout the month of September that earnings were not coming up to expectations of a higher level through the winter months. This was the graph I normally publish each month, and it does show a sort of trend of higher earnings from September onwards. It is hard to tell, to be honest!
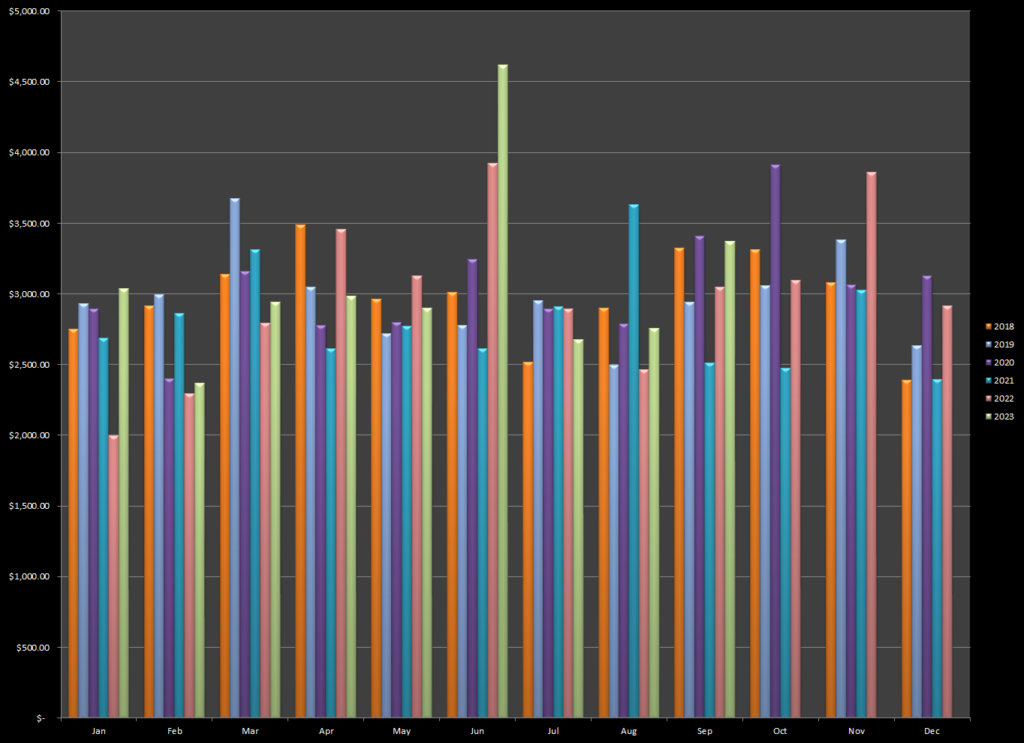
Looking at it now, with the high earnings up to $4500 in some months when Adobe pays out for its licensing of free images, and then the unexpected income from the AI training payment last month, if there is a trend it is hard to spot! And, to make matters worse, this combines income from stock agencies which tends to change in small increments together with much “lumpier” profits from far less frequent fine art print sales. So, what does it all mean?
To try to answer that question, I added more fields to my spreadsheet to break out the fine art prints separately, and then take each of the large one-off payments for free image licensing and AI training over the past three years and amortize each one over the 12 months following the payment. Adobe appears to be moving towards an annual payment (we hope) for AI training and so breaking down that income over the 12 months makes a lot more sense.
This gives me the following graph for the past 3 years:
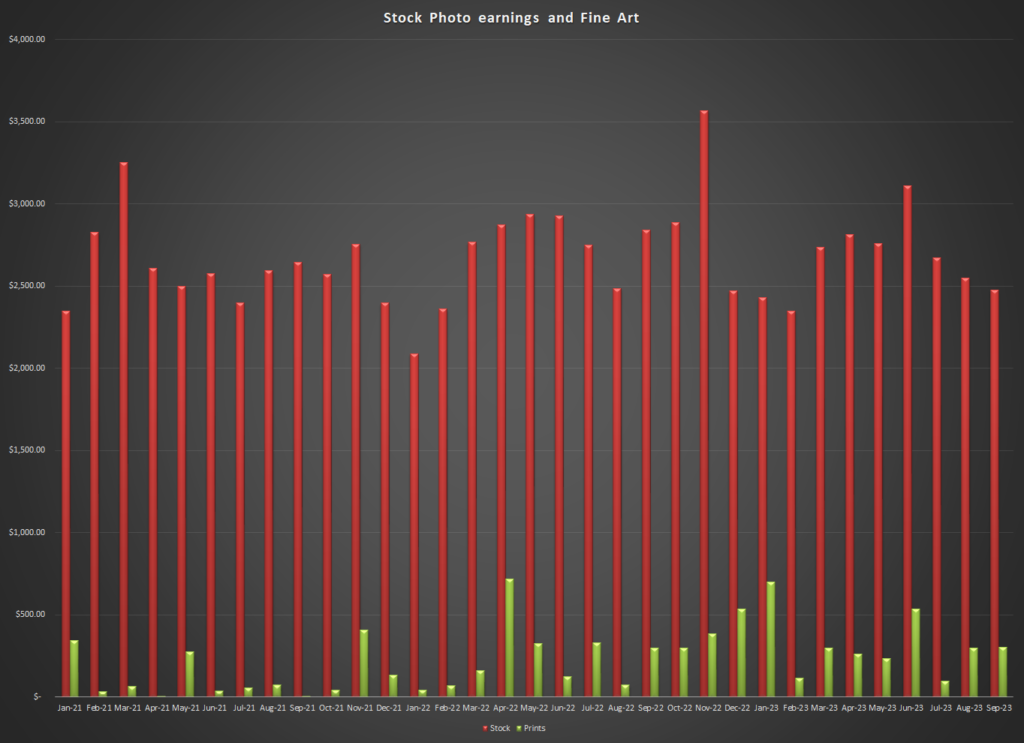
Now we can see more of a pattern. The profits from fine art print sales are variable, as we know, but can be a very nice addition to stock earnings. There is no real monthly trend there – they are higher in 2022 and 2023 as I put more work into promoting my print work (which you can read about here), but they don’t really follow a monthly pattern.
The stock earnings here do seem to be more interesting. Firstly, they aren’t really falling off much over the last 3 years. Yes, there is a downward trend from July onwards in 2023, but there were similar trends before and then a recovery. There are some outstanding months when I sold a greater volume of higher priced downloads. I didn’t write about it at the time in case they were reversed, but in November 2022, I had two fantastic licensed sales for $420 each for Juul vaping images.
Now what about combining the stock numbers to see if there is a pattern in monthly sales?
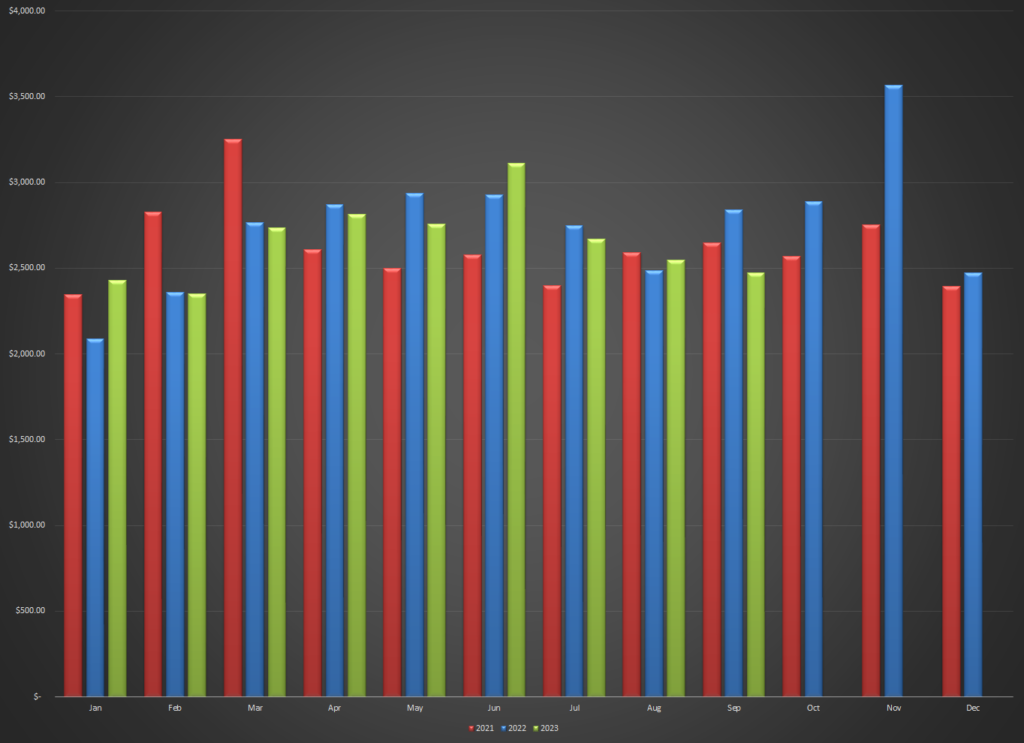
This graph is stock photos (and videos) only. It clearly shows that January and February are poor months. That is almost certainly because of the resetting of SS percentages on 1 Jan each year. An approach that still annoys me intensely! Then, the high months for me seem to be March through June or July and it falls off as December comes around. Overall, however, apart from December, January and February, it is pretty consistent perhaps. It will be interesting to see how the rest of 2023 turns out, but it does show there is still life in my sort of mixed portfolio. That coupled with, I hope, a growth in print work, gives me a warmer feeling for the near future.
I might be seeing trends where none exist, so feel free to comment below!